DASHBOARD MANUAL

Shield OnPremise

Download the PDF

Getting Started

Logging In

Logging In

To log into the Shield Dashboard, launch a web browser and enter: dashboard.intrusion.com.
If the page is unreachable, enter the IP address that was assigned to the Shield’s Management port instead.

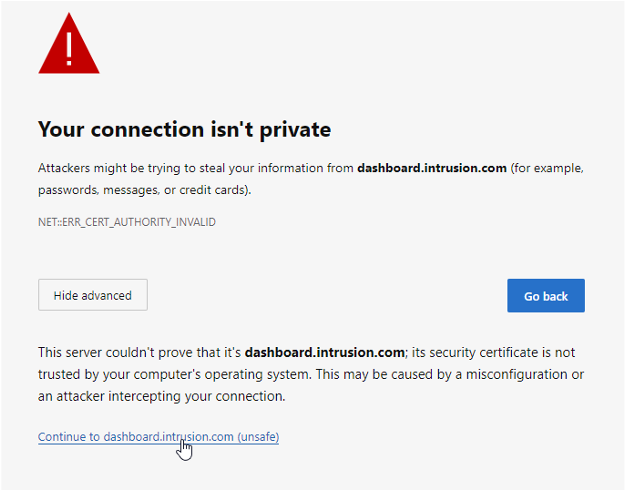
Upon successful connection to the Shield, a warning labeled “Your connection isn’t private” will be displayed.
This is because Shield uses a self-signed certificate.

Click Advanced to proceed.

Click "Advanced" Alert Box

Next, click Continue to dashboard.intrusion.com (unsafe)

Advanced options

The dashboard login page should now accessible. Use the username and password that you received from Intrusion. If you don’t have this information, please contact customer support.

Intrusion Shield Login

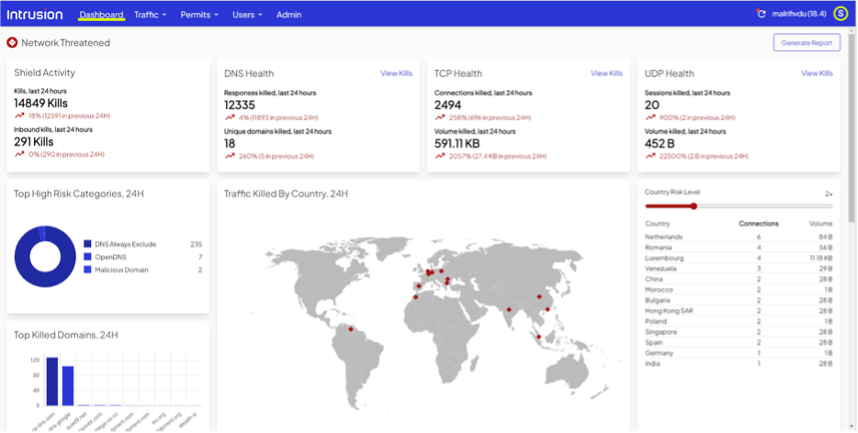
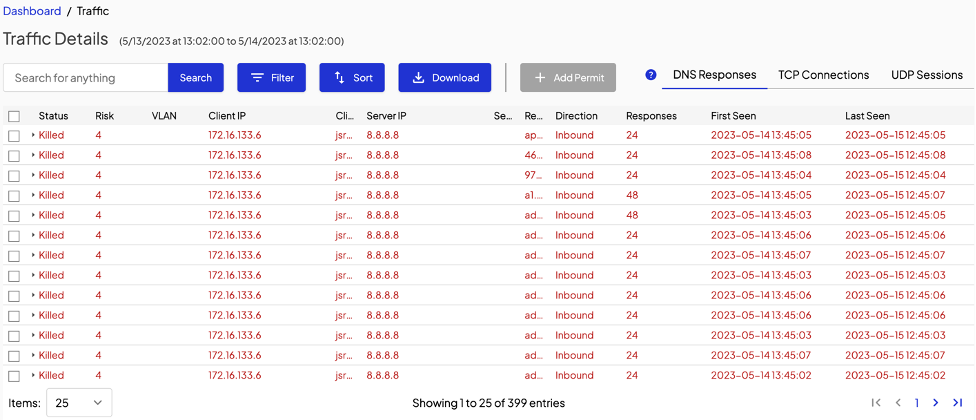
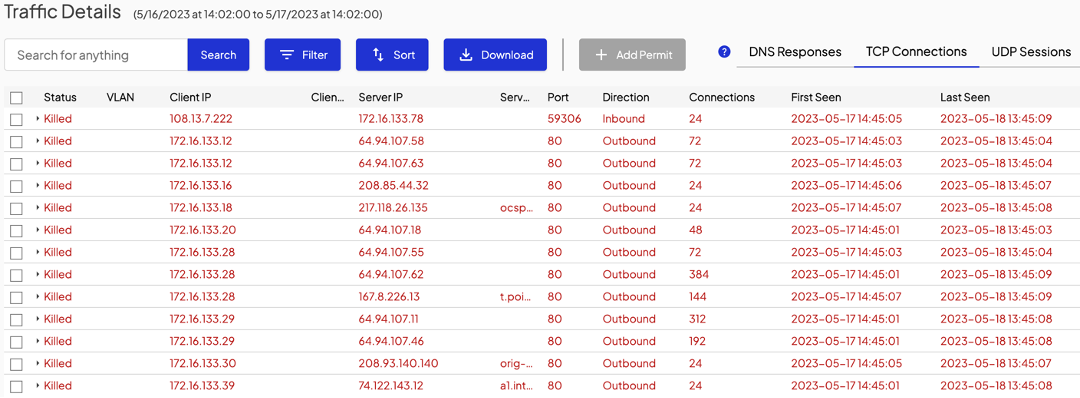
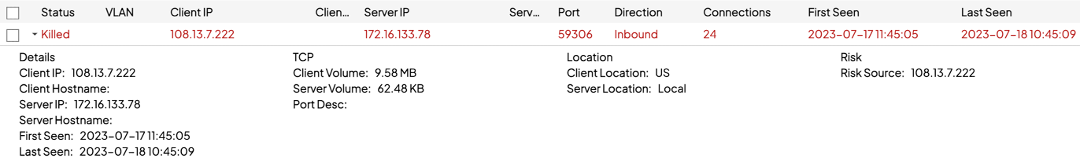
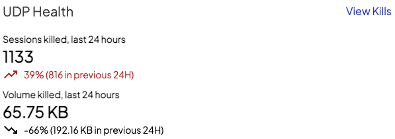
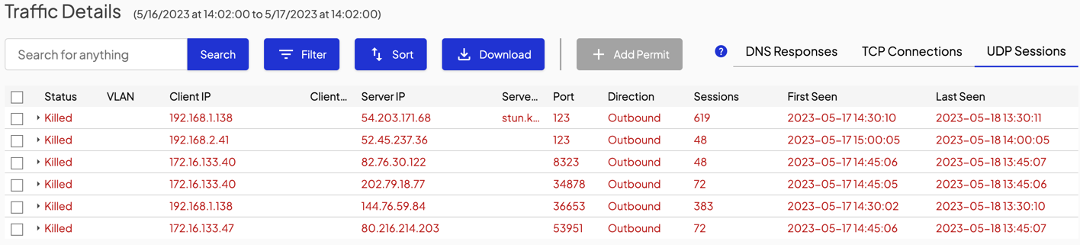
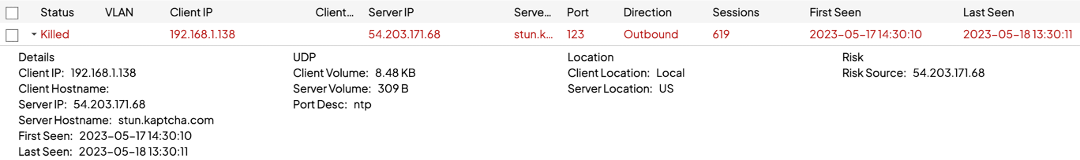
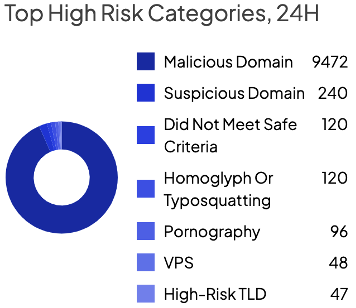
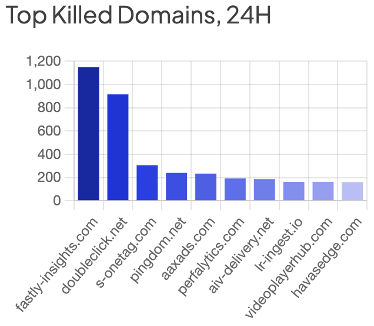
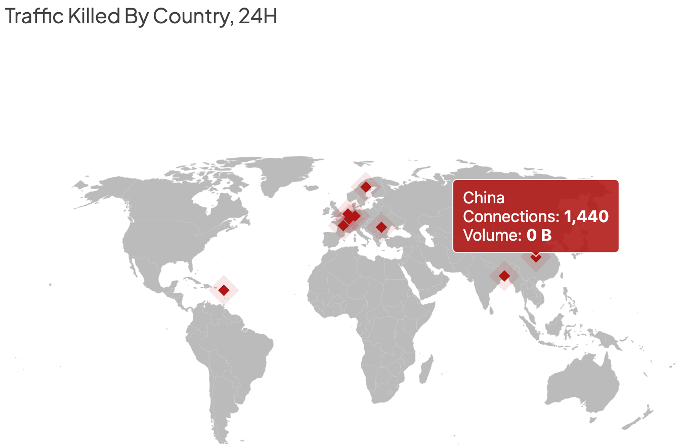
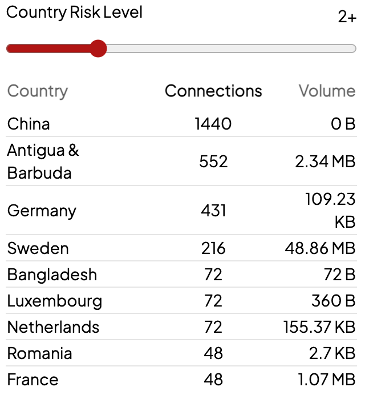
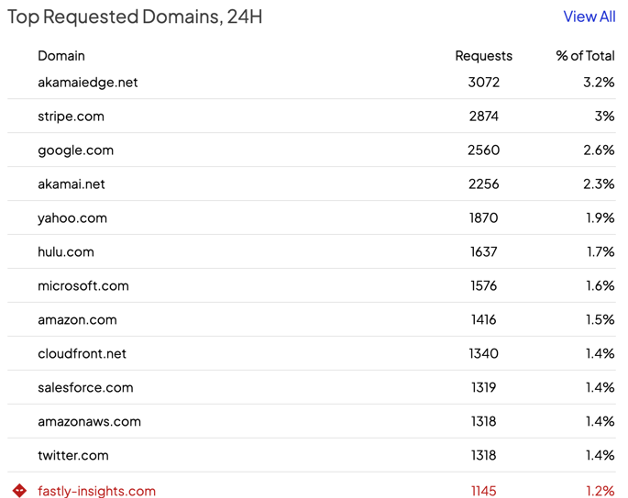
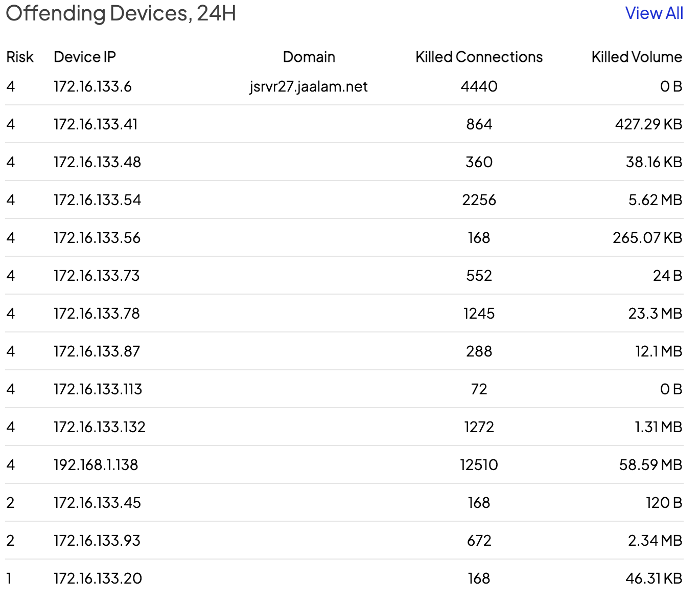
Once you’re logged in, the main dashboard should be visible. The dashboard will give you an overview of key security-related information generated by the Shield in the last 24 hours. This information should instantly refresh your situational awareness, enabling you to gauge your current security posture at a glance.

Intrusion Shield Home Dashboard

Dashboard Breakdown

Shield Activity

Shield Activity

The Shield Activity card displays the Shield’s total kills within the last 24 hours. That value is the sum of the DNS, TCP and UDP kills displayed on the three other cards to the right. This card also shows the percent of change from the previous 24-hour period. In addition, it also shows the total inbound kills and its corresponding percentage change.

Shield Activity

DNS Health

DNS Health

The DNS Health card displays DNS responses killed over the last 24 hours, as well as a breakdown of the number of unique domains killed during that time. It also shows the percent of change from the previous 24-hour period.

A DNS response originating from a malicious host is indicative of a cyber attack. To mitigate the risk of DNS-based attacks, Intrusion may block or kill a DNS response depending on the reputation of the DNS Query, the DNS response, or the Resolved IP. In many cases, multiple DNS responses may come from the same domain. That domain is counted as one unique domain.

DNS Health

Click View Kills in the top right corner of the card to display a table showing relevant traffic details for DNS Health. Each row in the table represents a DNS resolution passing through the Shield.

DNS Kills Details


The column descriptions are as follows:

Status Passed if the DNS response was allowed

Killed if the DNS response was killed based on the reputation of the DNS Query, the DNS response, or the Resolved IP

Note: if the Shield is in Observe mode, the Status column shows what would have been killed if the Shield was in Protect mode

Risk Risk level of the resolved DNS Query or DNS response (ranked from 1-5, with 1 being the lowest risk and 5 the highest)
VLAN VLAN on which this packet was observed, if present
Client IP IP address of the DNS Client performing the DNS query
Client Hostname The derived hostname of the client IP as observed in other DNS requests
Server IP IP address of the DNS Server answering the DNS query
Server Hostname The derived hostname of the server IP as observed in other DNS requests
Requested Hostname requested in the DNS transaction
Direction Direction of the DNS response:

Inbound if the client IP is on an internal network and the server IP is on an external network

Outbound if the client IP is on an external network and the server IP is on an internal network

Internal if both client IP and server IP are on internal networks

Unknown if both client IP and server IP are on external networks

Note this is the direction of the response packet, not the query packet

Responses Count of DNS RR records that were observed.  Note there may be multiple DNS RR records in one DNS packet
FirstSeen First time this event was seen in the observation period, in local browser time
LastSeen Last time this event was seen in the observation period, in local browser time

Click on a row to drill down for more details.

The following table describes each attribute shown above:
Note: Some attributes have already been defined in previous tables.

QName The hostname queried or requested in the DNS transaction
Domain The derived registered domain name of the Qname
CNAME If the DNS response returns CNAME entries, the final CNAME that resolves to an IP address
Answers The list of Ipv4 or Ipv6 addresses to which the DNS response resolves
Client Location The approximate geolocation of the Client IP, based on an IP geolocation database
Server Location The approximate geolocation of the Server IP.  If present, the traffic map and country listing will include statistics from this DNS record.
Risk Source The QName, CNAME or Answer IP that resulted in potential risk
Risk Level Level of risk for the DNS QName or CNAME (ranked 1-5, with 1 being the lowest risk and 5 being the highest risk)
Risk Class Generic category of risk
Risk Description Description of the risk class
TCP Health

TCP Health

The TCP Health card displays TCP connections killed over the last 24 hours, as well as the volume (expressed in Bytes) of connections killed during that time. It also shows the percent of change for each value from the previous 24-hour period.

A device or host in your organization that purposely or inadvertently establishes a TCP connection with a malicious client or server can put your organization at risk. To mitigate that risk, Intrusion may kill the said TCP connection based on the reputation of the client or server.

TCP Health

Click View Kills in the top right corner of the card to display a table showing relevant traffic details for TCP Health. Each row in the table represents a TCP connection passing through the Shield.

View TCP Kills

The column descriptions are as follows:

Status Passed if the TCP connection was allowed
Killed if the TCP connection was killed based on the reputation of the TCP Client IP or TCP Server IP
Note: if the Shield is in Observe mode, the Status column shows what would have been killed if the Shield was in Protect mode
VLAN VLAN on which this packet was observed, if present
Client IP IP address of the guessed endpoint performing the client role in the connection/session

If the TCP SYN packet is observed, then the Client IP is known

If the TCP SYN packet is not observed, then this is a guess based on sender/receiver port numbers

Client Hostname The derived hostname of the client IP as observed in other DNS requests
Server IP IP address of the guessed endpoint performing the server role in the connection/session

For TCP, if the TCP SYN packet is observed, then the Server IP is known

If the TCP SYN packet is not observed, then this is a guess based on sender/receiver port numbers

Server Hostname The derived hostname of the server IP as observed in other DNS requests
Port The TCP server port.

If the TCP SYN packet is observed, then the server port is known

If the TCP SYN packet is not observed, then this is a guess based on client/server port numbers

Direction Direction of the client relative to the server
Outbound  if the client IP is on an internal network and the server IP is on an external network
Inbound if the client IP is on an external network and the server IP is on an internal network
Internal if both client IP and server IP are on internal networks
Unknown if both client IP and server IP are on external networks
Responses (TCP) Count of the number of TCP SYN packets observed for this ClientIP/ServerIP/ServerPort tuple, or a minimum value of 1 if the TCP handshake was not seen
FirstSeen First time this event was seen in the observation period, in local browser time
LastSeen Last time this event was seen in the observation period, in local browser time

Click on a row to drill down for more details.

The following table describes each attribute shown above:
Note: Some attributes have already been defined in previous tables. 

Client Volume A sum of UDP payload observed (expressed in Bytes) sent from the client IP to the server IP for all connections associated with this row
Server Volume A sum of UDP payload observed (expressed in Bytes) sent from the server IP to the client IP for all connections associated with this row
Client Location The approximate geolocation of the Client IP, based on an IP geolocation database
Server Location The approximate geolocation of the Server IP

If present, the traffic map and country listing will include statistics from this UDP record

Risk Source The endpoint (client IP or server IP, or both) that triggered the risk alert
UDP Health

UDP Health

The UDP Health card displays UDP sessions killed over the last 24 hours, as well as the volume (expressed in Bytes) of sessions killed during that time. It also shows the percent of change for each value from the previous 24-hour period.

A device or host in your organization that purposely or inadvertently takes part in a UDP session with a malicious client or server can put your organization at risk. To mitigate that risk, Intrusion may kill the said UDP session based on the reputation of the client or server.

UDP Health

Click View Kills in the top right corner of the card to display a table showing relevant traffic details for UDP Health. Each row of the table represents a UDP session passing through the Shield.

UDP Traffic Details

The column descriptions are as follows:

Status Passed if the UDP session was allowed
Killed if the UDP session was killed based on the reputation of the UDP Client IP or UDP Server IP.
Note: if the Shield is in Observe mode, it shows what would have been killed if the Shield was in Protect mode
VLAN VLAN on which this packet was observed, if present
Client IP IP address of the guessed endpoint performing the client role in the connection/session

For UDP, as UDP sessions are stateless, this is a guess based on sender/receiver port numbers.

Client Hostname The derived hostname of the client IP as observed in other DNS requests
Server IP IP address of the guessed endpoint performing the server role in the connection/session

For UDP, as UDP sessions are stateless, this is a guess based on sender/receiver port numbers

Server Hostname The derived hostname of the server IP as observed in other DNS requests
Port The UDP server port.

For UDP, this is a guess based on sender/receiver port numbers

Direction Direction of the client relative to the server
Outbound if the client IP is on an internal network and the server IP is on an external network
Inbound if the client IP is on an external network and the server IP is on an internal network
Internal if both client IP and server IP are on internal networks
Unknown if both client IP and server IP are on external networks
Sessions (UDP) Count of the number of packets observed for this ClientIP/ServerIP/ServerPort tuple
First Seen First time this event was seen in the observation period, in local browser time
Last Seen Last time this event was seen in the observation period, in local browser time


Click on a row to drill down for more details.

UDP Kill Details

The following table describes each attribute shown above:
Note: Some attributes have already been defined in previous tables. 

Client Volume A sum of UDP payload observed (expressed in Bytes) sent from the client IP to the server IP for all connections associated with this row
Server Volume A sum of UDP payload observed (expressed in Bytes) sent from the server IP to the client IP for all connections associated with this row
Client Location The approximate geolocation of the Client IP, based on an IP geolocation database
Server Location The approximate geolocation of the Server IP

If present, the traffic map and country listing will include statistics from this UDP record

Risk Source The endpoint (client IP or server IP, or both) that triggered the risk alert
Top High Risk Categories, 24H

Top High Risk Categories, 24H

This chart shows a breakdown of top high risk categories and the number of kills for each category in the last 24 hours.

Top High Risk Categories

Top Killed Domains, 24H

Top Killed Domains, 24H

This chart shows a breakdown of top killed domains, and the number of kills for each domain in the last 24 hours.

Top Killed Domains

Traffic Killed by Country, 24H

Traffic Killed by Country, 24H

This map shows a breakdown of traffic killed by country, including the number of connections and volume killed. It directly correlates to the Country Risk Level Slider to the right.

Traffic Killed by Country

Country Risk Level

Country Risk Level

This interactive slide chart shows Country, Connections, and Volume and reflects it on the map to the left. Move the slide to a chosen risk level to see the results displayed. The Country Risk Level value is a static value assigned per country based on the general risk level of threats emanating from that country. The Country Risk Level is representative of a country as a whole and is unrelated to the DNS Risk Level.

Country Risk Level

Top Requested Domains

Top Requested Domains

This chart depicts the top requested domains, the number of requests, and the domain’s percent of the total number of requests for the last 24 hours. Domains in red with the Intrusion avatar represent killed domains.

Top Requested Domains List

Click View All to load a page that shows all the domains, as well as corresponding request count and percent of total. Select an option button to filter by All, Killed, or Passed for the past 24 hours. You may also utilize the search bar to filter for a specific domain.

All Requested Domains List

Offending Devices, 24H

Offending Devices, 24H

This chart shows internal offending devices for the last 24 hours. Sorted by risk level, each item displays the risk level, device IP, domain (if available), number of killed connections, and the killed volume. The Offending Devices risk level is a calculated score based on the Domain Risk Level of the requests from the device in question and its volume of high-risk connections.

Offending Device List

Click View All to load a page that displays all the offending devices for the last 24 hours. You can search for a specific device and filter by risk level or device IP/CIDR. You may also change how the information is sorted, as well as download the information in the form of a CSV or JSON file.

All Offending Devices List

Traffic Tab

Record Session

Record Session

Select Record Session to start a recording session. Recorded sessions enable you to easily find connections that the Shield blocked. This is an excellent tool for troubleshooting.

Start Recording Session

Map

Map

Select Map to open the interactive map page. On the map, you can select specific countries to see attempted connections from that location to your network. The chart to the right of the map displays attempted connections, sorted by highest risk level, and gives further information. DNS, TCP, and UDP information is also displayed below the map. Click DNS Responses, TCP Connections, or UDP Sessions on the right side of the screen to view related information.

Traffic Map

All Traffic

All Traffic

Select All Traffic to view DNS responses, TCP connections, or UDP sessions, based on user selection. This tool is useful for sorting through a high volume of blocked connections to discover potential vulnerabilities. If you select a specific item, you’ll be given the option to add a permit for the selected item. Before adding permits, read the section on Permits first.

All Traffic

Reports

Reports

Select Reports to download a PDF report that captures a snapshot of kills, observed bandwidth, new domains, and new devices for a given day or month.

Reports List

Permits

A permit essentially allows a chosen DNS, TCP, or UDP connection to pass through. Please remember to exercise caution when adding permits. Intrusion recommends only adding known, trusted connections, and not permitting more than necessary.

Manual Permits

Manual Permits

Select Manual Permits to permit specific connections to override the Intrusion filter. Specify an IP address, a domain or host or a CIDR range. Use the + button at the top of the page to add a permit. Note: The reason field is required and special characters will not be accepted.

Manual Permits

Manual Permit Success

Auto Permits

Auto Permits

Select Auto Permits to display a list of permits that were automatically added by the Shield. If a DNS answer is observed for a domain that is on the Intrusion priority allow list or is a customer Manual Permit domain, but the resolved IP would otherwise be blocked, then an Auto Permit triggers a temporary unblock of that resolved IP for the duration of the DNS TTL. The chart shows both active and expired auto permits. You may filter the items based on permit type and status.

Auto Permits

Users

Users

Users

Select Users to load a page that shows a list of accounts currently enabled on the Shield. Administrators can change or add users.

Users Page

Logs

Logs

Select Logs to load a page that shows user activities, along with corresponding timestamp and IP address.

User Logs

Admin

Shield Settings

Shield Settings

The Admin page will only show if a user has admin access.

Admin Shield Settings

Shield Mode

Shield Mode

Click Change Shield Mode to change the operating mode of the Shield.

  • Protect Mode: Records all traffic and blocks unsafe connections
  • Observe Mode: Records all traffic but does not block any connections

Off:  The Shield analysis engine is off and all packets are forwarded without being analyzed, logged or blocked

Note: For quick network connection troubleshooting, place the Shield in Observe or Off mode. If the connection works in Observe or Off, but not in Protect, the Shield may be blocking the connection. Please contact customer support if you encounter any problems.

Protect Mode

SNMP

SNMP

This allows an admin to turn on the SNMP service and download the Shield SNMP MIB definitions for import into 3rd party SNMP monitoring tools. The SNMP server reports interface statistics such as packet and bitrate counts, as well as number of kills.

SNMP Disabled

Syslog

Syslog

When turned on, this will give an admin the ability to configure syslog forwarding to a remote syslog server.

Syslog Disabled

Management Interface

Management Interface

Shows the details of the Shield’s management interface port. By default the management interface is assigned via DHCP.  Click Change Interface to manually configure the management interface.

Management Interfaces

Remote Support

Remote Support

This shows when remote support is active for the Shield, and gives the option to contact support.

Remote Support

Landing Page Settings

Landing Page Settings

The Shield Landing Page appears to all devices behind a Shield when attempting to access a killed website. It will display the unsafe source(s) that caused the kill and allow the device to permit the source(s) if the device meets the Landing Access IPs criteria.

Landing Page Logo

You may add a logo that will show when an end user reaches the Shield blocked site page. To add a logo, drag and drop your image file into the space provided or click the space to upload your image file.

Landing Page Logo Add

Landing Access IPs

Here, you can specify which devices can add manual permits. If no addresses are entered into this section, any user that reaches the Shield’s blocked site page will be able to enter manual permits. By entering an IP address or range in the dialogue box, you can limit the ability to add manual permits to devices with the specified IP addresses. Users who attempt to add manual permits from devices with unauthorized IP addresses will be prompted to reach out to their network administrator. IPs added here will allow machines bearing those IPs to manually add permits from the popup. This policy does not affect the admin’s ability to add permits from the dashboard. It is highly recommended that admins restrict the ability to add manual permits.

Landing Access IPs

Shield Info

Shield Info

Gives all information about the Shield.

Shield Info

Additional Functionality

Using Shield OnPremise

Using Shield OnPremise

Users who attempt to navigate to a site that the Shield blocks will see the page below.

As was in the case when loading the dashboard, users will see an error caused by the Shield having a self-signed certificate. For them to proceed, have your users click Advanced.

Click "Advanced" Alert Box

Your users will then be forwarded to the Shield blocked site landing page. In order to proceed, they should click the Request Access button.

Request Access
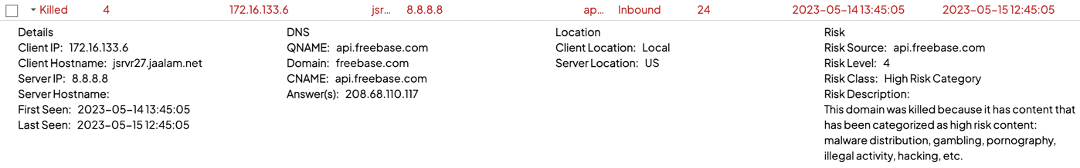
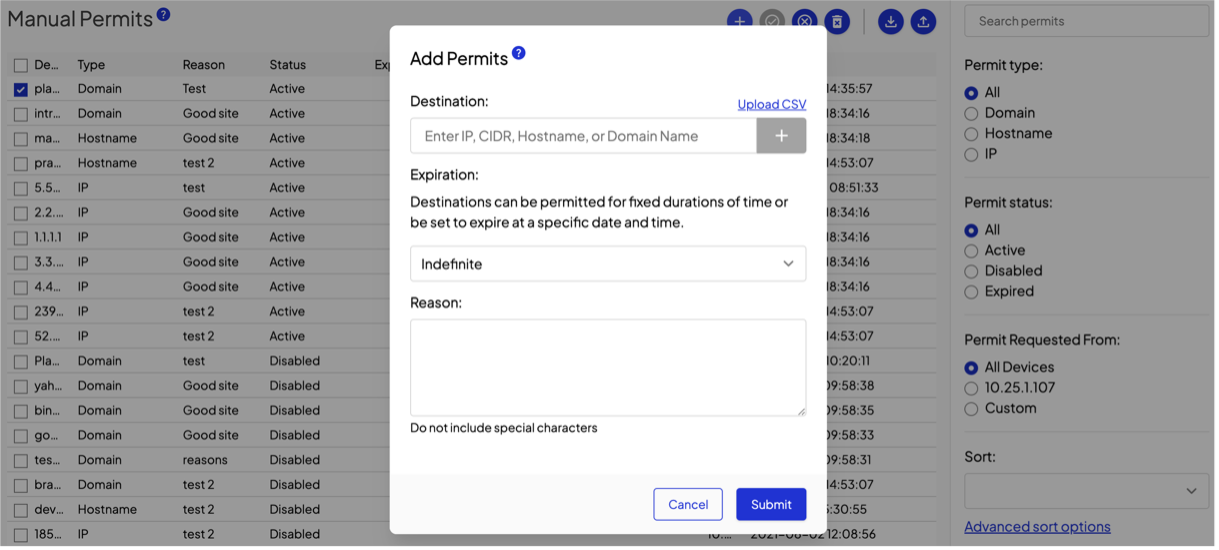
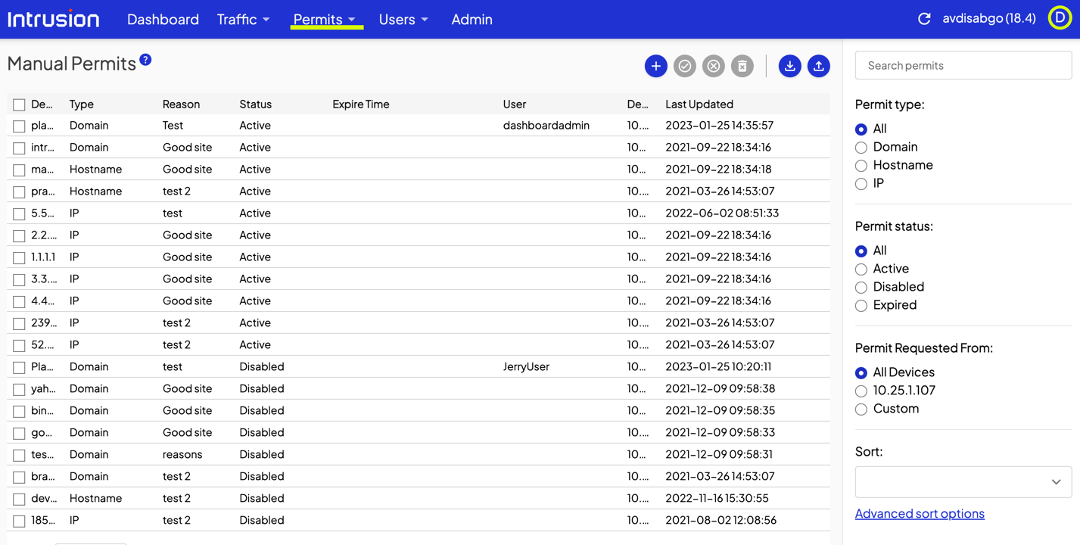
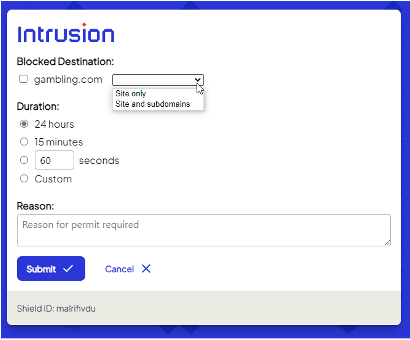
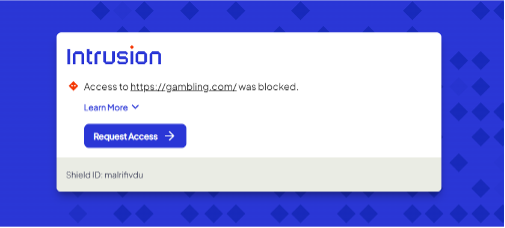
That user action will prompt the Shield to present you, the admin, a dialogue that looks very similar to the manual permit page in the dashboard. Check the connections to permit a specific site only or the site and all its subdomains.

Permit Request

However, if an admin has restricted the ability to add permits, the end user will be asked to contact the network administrator.

Contact Admin Notification

Release Notes

Shield OnPremise 19.2-14

Shield OnPremise 19.2-14

Release 19.214 is a bugfix release for existing systems running 19.1.x and 19.2.x 

Bug Fixes 

Fixed numerous issues in the TCP connection handling: 

  • Fixed an issue where TCP packet connections were processed twice, leading to possible exhaustion of TCP buffers that produced Out of Connection Memory errors and resulted in dropped TCP connections in Protect mode 
  • Fixed an issue that erroneously reported Too Many Bytes in TCP Packet 
  • Fixed an issue in TCP reassembly related to reset (RST) packets 
  • Fixed an issue with Packet File System (PFS) connection recording and retrieval 
  • Fixed an issue where some TCP packets were not assigned a client/server view 
  • Fixed issues in TCP window handling 
Shield OnPremise 19.1

Shield OnPremise 19.1

Release 19.1 contains a re-architecture of the core packet processing engine of Shield for performance improvement and a base operating system rebase. 

Enhancements 

  • The Landing page automatically redirects to the Renderer to safely render a page. The user no longer has to click through multiple steps to launch the Renderer. 
  • Support for XDP hardware multiqueue, which better load balances network connections over multiple CPU cores.  This allows for higher potential speeds with more CPU cores. 
  • Operating System and kernel are upgraded to a newer version. 
  • SecureBoot is enabled and bootable media is restricted. 

Need help? Contact us.